By GPC Reporter
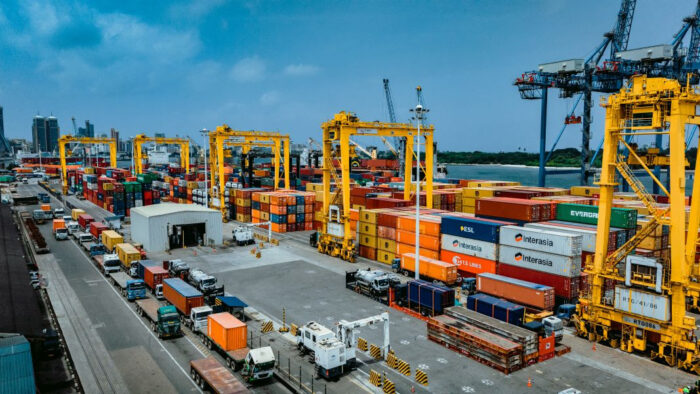
Trade within the East African Community rose 37 per cent to $52.3 billion in the second quarter of 2026, as stronger exports helped the region record a trade surplus.
The increase, from $38.2 billion in the same quarter of 2025, was driven by a 41.3 per cent rise in exports to $26.3 billion, while imports grew by 32.9 per cent to $26 billion, according to the EAC Quarterly Statistics Bulletin for April-June 2026.
Also Read
The region recorded a trade surplus of $300 million, compared with a deficit of $945.3 million a year earlier.
African markets remained an important destination for EAC exports, which rose by 44.3 per cent to $7.2 billion, accounting for 27.5 per cent of total exports.
Exports to the Southern African Development Community increased by 50.8 per cent to $5.1 billion, while those to the Common Market for Eastern and Southern Africa rose by 48.3 per cent to $3.1 billion.
Intra-EAC exports also grew by 33.2 per cent to $3.2 billion. However, their share of total EAC exports declined from 12.8 per cent in the second quarter of 2025 to 12.1 per cent in the latest quarter, as exports to markets outside the Community grew at a faster pace.
China remained the region’s largest individual export destination and source of imports. EAC exports to China nearly doubled from $5.7 billion to $10.7 billion, mainly driven by mineral commodities and other raw materials, while imports from China increased from $4.7 billion to $7.1 billion.
The United Arab Emirates and South Africa were also major destinations for EAC exports, while India, the UAE, Saudi Arabia, the United States and Japan were among the leading sources of imports.
The bulletin said copper and precious metals accounted for 61.9 per cent of total exports, up from 58.7 per cent a year earlier, underscoring the region’s continued reliance on mineral earnings. Coffee, tea and spices remained significant agricultural exports, while petroleum products were the largest import category, followed by machinery, transport equipment and industrial supplies.
Inflation eases
Inflationary pressures eased during the quarter, with annual headline inflation across the EAC, measured through the EAC Harmonised Consumer Price Index, falling from 11.1 per cent in April to 10.7 per cent in May and 7.8 per cent in June.
The June rate was sharply lower than the 22.7 per cent recorded a year earlier. On a month-on-month basis, the regional price index fell by 0.8 per cent in June after rising by 1.2 per cent in May.
However, underlying price pressures remained. Core inflation rose from 6.2 per cent in April to 6.4 per cent in May and 7 per cent in June, although the June figure was well below the 19.3 per cent recorded a year earlier.
Food inflation increased to 10.1 per cent in June from 9.5 per cent in May but remained significantly below the 37.5 per cent recorded in June 2025.
Energy, fuel and utilities inflation fell from 14.2 per cent in May to 11.1 per cent in June, although it remained above the 6.3 per cent recorded a year earlier.
Among the Partner States covered by the EAC-HCPI, June annual headline inflation stood at 13 per cent in Rwanda and South Sudan, 8 per cent in Burundi, 6.5 per cent in Kenya, 4 per cent in Tanzania and 3.7 per cent in Uganda.
For the 2025/26 financial year, regional annual average headline inflation declined to 14.2 per cent from 23 per cent in 2024/25. The bulletin attributed the decline largely to lower inflation in South Sudan and Burundi, where annual average rates fell from 179.4 per cent to 43.2 per cent and from 33.3 per cent to 18 per cent, respectively.
Interest rates and credit
Interest rate movements varied across the region during the quarter.
Tanzania recorded the largest decline in its 91-day Treasury bill rate, which fell by 60 basis points to 3.6 per cent. Kenya recorded the largest increase, rising by 120 basis points to 8.7 per cent, while Uganda had the highest rate among the reporting Partner States at 10.2 per cent.
Lending rates rose in Tanzania, Burundi and Rwanda, with Rwanda recording the largest increase of 30 basis points to 14.4 per cent. Rates declined in Kenya, Uganda and South Sudan.
Uganda’s lending rate fell from 18.9 per cent to 16.9 per cent but remained the highest among the reporting Partner States.
Deposit rates increased in Tanzania, Burundi and Rwanda but declined in Kenya and Uganda, while South Sudan’s rate remained unchanged.
South Sudan recorded the widest gap between lending and deposit rates at 15.6 percentage points, while Rwanda had the narrowest at 4.3 percentage points.
Credit expanded across several major sectors. Lending to wholesale and retail trade grew by 29.1 per cent year-on-year, agriculture by 25.6 per cent and construction by 22.9 per cent. Real estate lending increased by 6.2 per cent, while manufacturing grew by 0.9 per cent.
The household sector held the largest amount of outstanding loans at $17.6 billion, followed by wholesale and retail trade at $11.6 billion.
Broad money supply (M3) increased by 15.3 per cent year-on-year to $107.7 billion, supported mainly by a 15 per cent rise in credit to the private sector to $75.9 billion.
Net foreign assets rose by 19 per cent to $25.4 billion, while net credit to central governments increased by 7.5 per cent to $37.5 billion.
In contrast, net credit to public non-financial corporations declined by 3.1 per cent to $650 million.